5.9. Python Descriptive Statistics Cheat Sheet#
Random number generation#
Use a random number generator (RNG) to generate simulated data. This can be useful to test statistics and simulate experiments.
import numpy as np
rng = np.random.default_rng(1)  # the input is a seed value
print(rng.random())             # generate a value between 0 and 1
print(rng.random())             # another value
rng = np.random.default_rng(1)  # reset to the same seed
print(rng.random())             # generate the same "random" values as before
print(rng.random())
rng = np.random.default_rng(2)  # each seed results in different "random" values
print(rng.random())
print(rng.random())
0.5118216247002567
0.9504636963259353
0.5118216247002567
0.9504636963259353
0.2616121342493164
0.2984911434141233
rng = np.random.default_rng(1)
print(rng.random(10))  # if a size is passed, will generate multiple values
[0.51182162 0.9504637  0.14415961 0.94864945 0.31183145 0.42332645
 0.82770259 0.40919914 0.54959369 0.02755911]
Histograms#
Use a histogram to visualize how values within a sample vary.
rng = np.random.default_rng(1)               # seed an RNG
age = rng.normal(loc=25, scale=5, size=100)  # generate random with mean=25, sd=5
import matplotlib.pyplot as plt  # import the plotting library
plt.hist(age);                   # plot a histogram (; suppresses outputs)
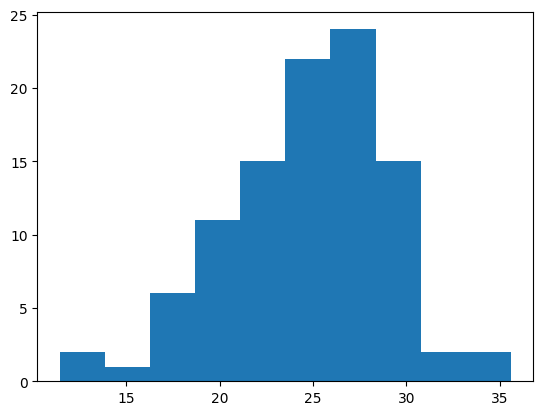
values, edges, patches = plt.hist(age)  # capture outputs with information
print(values)                           # counts of each bin
print(edges)                            # bin edges
print(patches)                          # object with graphics information
[ 2.  1.  6. 11. 15. 22. 24. 15.  2.  2.]
[11.44418761 13.85868822 16.27318884 18.68768946 21.10219007 23.51669069
 25.93119131 28.34569192 30.76019254 33.17469316 35.58919378]
<BarContainer object of 10 artists>
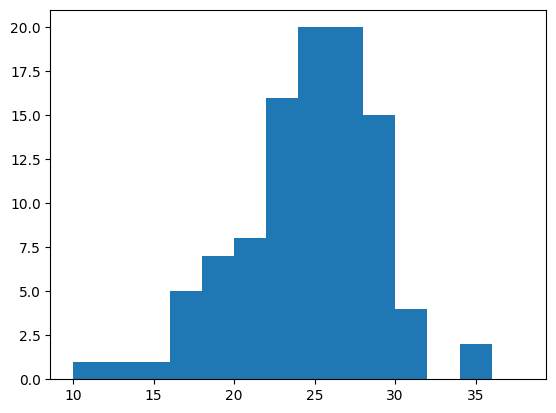
bins = np.arange(10, 40, 2)  # generate bins for every two years
plt.hist(age, bins);         # plot with specified bins
Statistics#
NumPy has various functions for calculating statistics that summarize properties of a distribution.
from scipy import stats  # more advanced stats than in NumPy
rt = stats.exponnorm.rvs(3, loc=4, scale=.2, size=500, random_state=1)
plt.hist(rt);
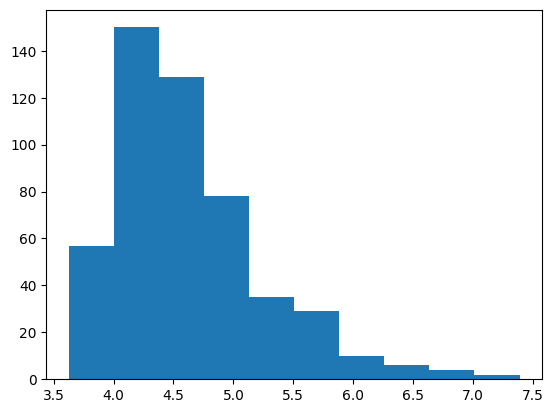
print(np.mean(rt))    # mean
print(np.median(rt))  # median
print(np.std(rt))     # standard deviation
4.624016040529304
4.503273307197041
0.627687628600481
print(np.min(rt))                               # minimum
print(np.max(rt))                               # maximum
print(np.percentile(rt, [10, 30, 50, 70, 90]))  # percentiles
3.6251627143722267
7.388075995298707
[3.95735856 4.25210519 4.50327331 4.79969666 5.51067011]
Missing data#
In NumPy, missing datapoints are represented by NaN (not-a-number).
print(np.nan)            # create a NaN value using np.nan
print(np.nan + 4)        # any operation with NaN is NaN
print(np.nan == np.nan)  # a NaN is not equal to another NaN
print(np.isnan(np.nan))  # use isnan to check if a value is NaN
nan
nan
False
True
accuracy = np.array([0.87, 0.68, np.nan, 0.57, 0.51, np.nan])
print(np.mean(accuracy))     # mean of a sample with NaNs is NaN
print(np.nanmean(accuracy))  # can use nanmean to exclude NaNs
print(np.nanstd(accuracy))   # stat functions have nan version that excludes NaNs
nan
0.6575
0.13699908758820256